📉 The Hottest US Inflation in Three Years Landed — and the Rand Gained 30 Cents Anyway
Published 15 June 2026
A week ago, a single number out of Washington wiped out a fortnight of the Rand's gains in one afternoon.
This week, the Rand took them back — and it did it in the teeth of the hottest US inflation reading in three years, with the dollar sitting near a two-month high.
Every textbook said the Rand should have softened. It closed 30 cents stronger instead.
Here's how it played out.
But first — the call we put out on Friday 5 June, with the Rand still up at R16.51
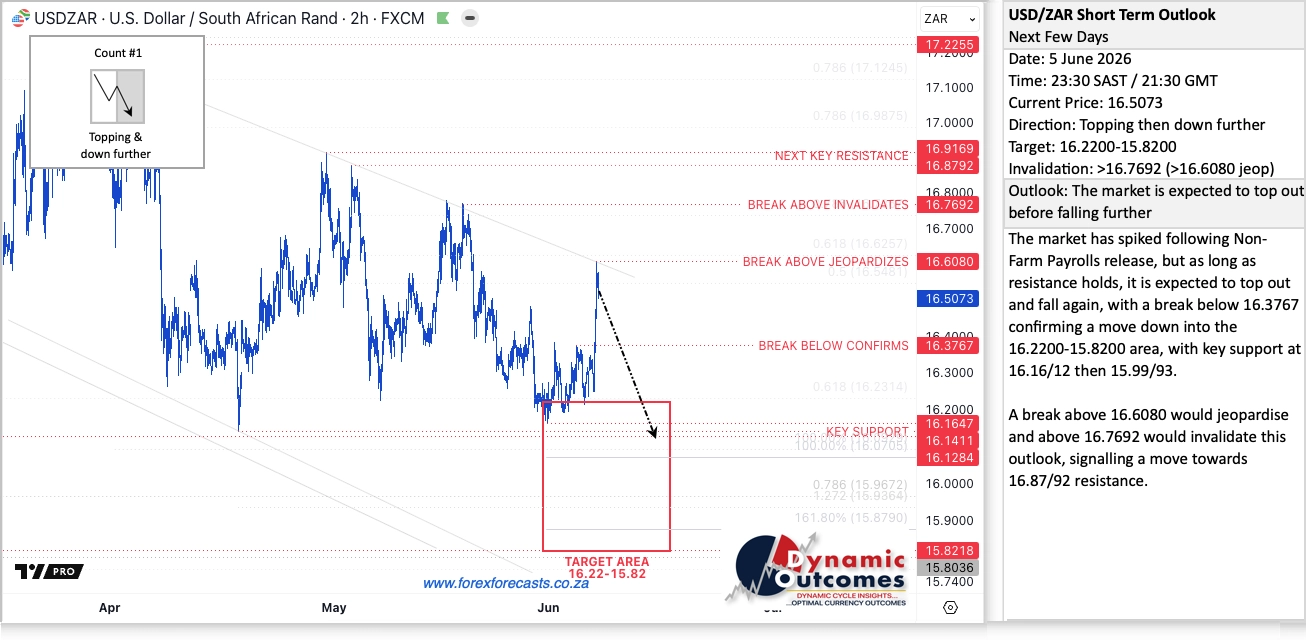
USDZAR Short Term Outlook · 5 June 2026 · Direction: topping, then down further · Confirmation below R16.38 · Target zone: 16.22–15.82 · Invalidation: above R16.77
The chart drew the lines before the week began: a top, a confirmation level at R16.38, a target down at R16.22, and the one line that would have proved it wrong — R16.77. The Rand topped on Monday, broke below R16.38 on Thursday, and reached the top of that target zone on Friday. The invalidation never came close.
Key Moments (8–12 June 2026)
A few of the major headlines and events over the past five days:
🌍 One Oval Office Headline Moved Everything. A Thursday-afternoon comment on Iran sent oil tumbling and yields with it — and the Rand was perfectly placed to catch the wave.
🇺🇸 US Inflation Hit a Three-Year High. Wednesday's CPI ran the hottest since 2023, Thursday's wholesale figure hotter still — and the market did the opposite of what it should.
🇿🇦 South Africa Grew for a Sixth Straight Quarter. Tuesday's GDP beat the forecast — a quiet bit of home-grown strength, two days before the week's real catalyst arrived.
🏭 A Two-Speed Economy in a Single Morning. Thursday's data split the country in half — and for the Rand, only one half mattered.
📊 The Friday Forecast Came Good. A week before the move, our short-term call marked the top and the target — and the Rand walked the whole route.
Monday: A Tense, Top-Heavy Start 📉
Monday opened with the Rand on the back foot, and for a few hours it looked like the wrong kind of week.
The unit started at R16.59/$ and pushed straight to its weekly high of R16.66/$ by 09:00 SAST, dragged there by a dollar sitting near a two-month peak and an oil price climbing on a fresh flare-up in the Middle East. Brent was back near $94 a barrel, the Strait of Hormuz was in the headlines again, and the global mood was distinctly risk-off.
Then the tide turned through the day. As the oil bid faded and equity markets steadied, the Rand clawed its way back, closing at R16.52/$, seven cents firmer than it started. The worst level of the week had landed in the first two hours — and then four days of grind in the other direction.
Tuesday: Home Ground Holds 📈
Tuesday belonged, briefly, to South Africa.
At 11:30 SAST, Stats SA reported that the economy grew 0.5% in the first quarter, ahead of the 0.3% the market had pencilled in, and the sixth consecutive quarter of expansion. Nine of the ten sectors grew, with finance the biggest contributor and agriculture the fastest riser, and only manufacturing went backwards.
The Rand opened at R16.49/$, dipped to R16.40/$ around midday, then drifted back to settle at R16.52/$ into the close — a couple of cents softer, but holding its range. The GDP beat did not light a fire under the currency on the day. What it did was give the Rand a floor, just as the week's real catalyst was being set up two days out.
Wednesday: The Inflation Number That Should Have Stung 📈
Wednesday brought the reading everyone had been waiting for, and on paper it was ugly for the Rand.
At 14:30 SAST the US Bureau of Labor Statistics released May consumer prices, and the headline came in at 4.2% on the year — the fastest annual pace since April 2023, driven almost entirely by a 23.5% surge in energy costs over twelve months. A hot inflation number does one thing to this market: it pushes a Federal Reserve rate cut further out of reach, and a dollar earning more carry is a dollar the Rand normally cannot fight.
The Rand duly softened, opening at R16.52/$ and easing to close at R16.58/$, six cents weaker on the day — exactly the reaction the textbook would predict.
But look one layer down, and the cracks were already showing. The core reading came in at just 0.2% on the month, cooler than expected. The entire inflation overshoot was an energy story — and energy, as Thursday would prove, was about to go into reverse.
The War Sitting Behind Every Market 🌍
It is worth naming the force behind almost every move this week: the standoff between the United States and Iran. The week opened with escalation — a fresh round of US strikes, the sharpest flare-up since the spring ceasefire fell apart — and with it the old fear that the Strait of Hormuz, through which roughly a fifth of the world's oil passes, could close.
That is why the Rand started the week on the back foot, and why both oil and the dollar were bid. When Hormuz is in the headlines, capital runs for cover and the energy premium climbs — and for a commodity-sensitive, high-yield currency, that is a double headwind.
The picture shifted dramatically mid-week, as Thursday's session will show. But the lesson holds: until a deal is actually signed, the Rand's path runs through the Persian Gulf as much as through Pretoria or Washington.
A Record Surplus Beneath the Surface 🇿🇦
Beneath the week's daily noise, the Reserve Bank's latest Quarterly Bulletin pointed to something more durable. South Africa ran a current-account surplus of R190.7 billion in the first quarter, around 2.4% of GDP and the largest in more than four years, as the trade surplus widened on the back of stronger net gold exports.
This matters because it gives the Rand something day-to-day sentiment cannot: a genuine fundamental floor. A country selling far more to the world than it buys does not have to rely on fickle foreign capital to fund itself, and with gold and platinum prices elevated, those export receipts are flowing in faster than they have in years. It is the quiet structural support sitting underneath whatever the headlines throw at the currency on any given day.
Washington Turns Up the Trade Heat ⚖️
A reminder, too, that the bigger Rand risk this year may not be the Fed at all. Pretoria has signalled it is preparing retaliatory measures after the United States moved toward an additional 12.5% tariff on a range of South African goods, with public hearings set for early July.
The dispute traces back to a Section 301 finding, and whatever one makes of the politics, the trade exposure is real. AGOA access runs only to the end of the year, and a tit-for-tat escalation would land on the Rand long before it lands on a negotiating table. The market is looking past it for now, but it will not always have that luxury.
To get back to the Rand — because for all the structural support sitting underneath it, the week still came down to a single evening.
Thursday: The Day the Floor Fell Out of Oil 📉
Thursday was the whole week. Everything before it was setup, and everything after it was confirmation.
It started hawkishly enough. At 14:30 SAST the wholesale inflation number — producer prices — landed even hotter than CPI, running at 6.5% on the year, the steepest in over three years. On any normal day that screams dollar strength. And yet the Rand barely flinched, holding firm around R16.52/$ right through the European afternoon, as if the market had stopped listening to inflation data altogether.
Then, just after 19:00 SAST, the headline hit. Speaking from the Oval Office, President Trump declared the conflict with Iran "basically settled" and said a deal could be signed within days — reopening the prospect of the Strait of Hormuz staying open and the war premium draining out of crude.
The reaction was instant and it was everywhere. Brent crude fell more than 4% in a matter of hours. US Treasury yields followed it down, the ten-year shedding roughly ten basis points as the inflation scare deflated. Equity markets turned higher, and money rotated straight back into the higher-yielding corners of the currency market.
And the Rand? It went off like a coiled spring — from R16.53/$ to R16.32/$ in a single hour, and on to close at R16.26/$. Thirty-one cents of Rand strength in one afternoon, the entire move stacked into the hours after that one comment.
Buried under the drama, the local data told its own split story. Mining output for April rose 8.2% on the year, platinum-group metals up a remarkable 36.5%, while manufacturing went the other way, down 2.9%. A two-speed economy in a single morning: the shafts running hot, the factory floor running cold.
Friday: Holding the Gains 📈
Friday's job was simply to keep what Thursday won, and it did.
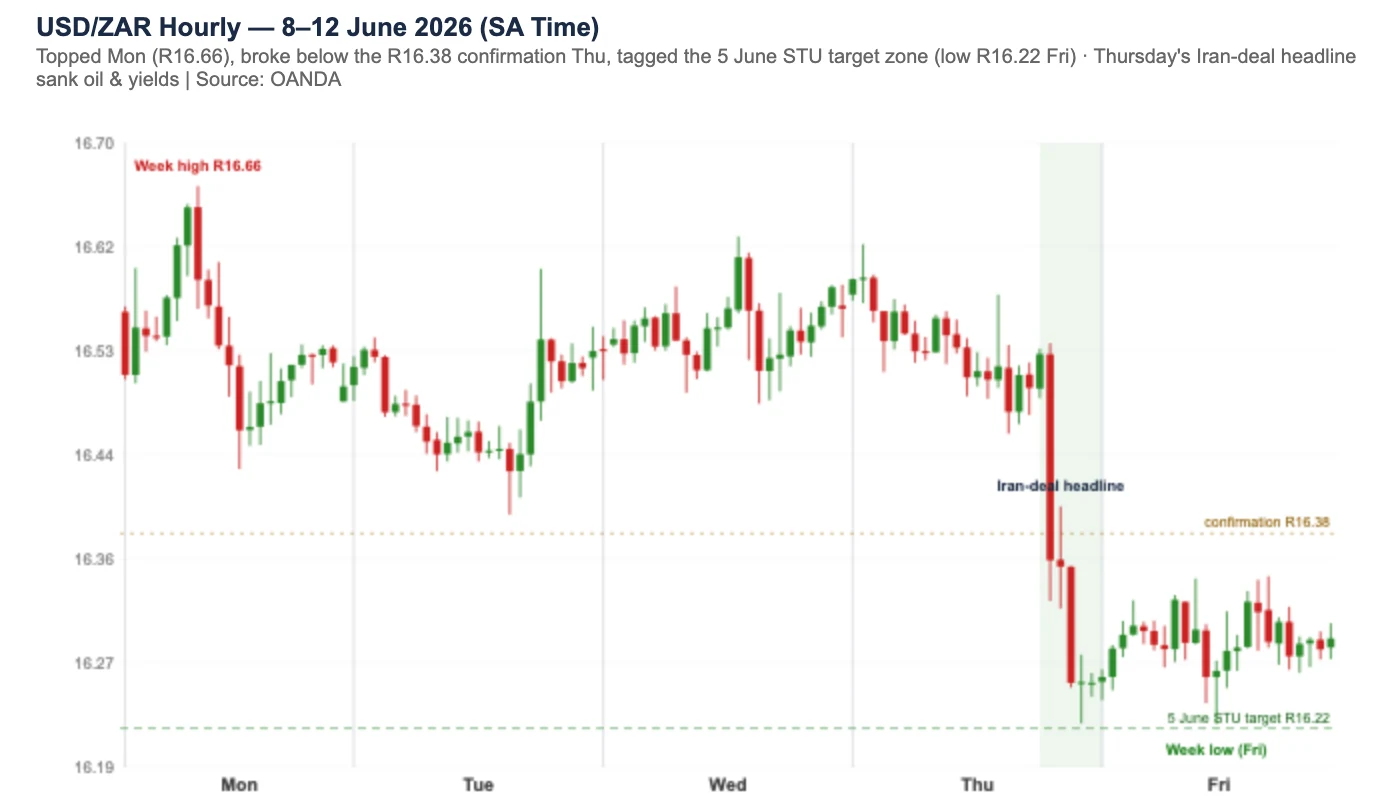
The Rand opened at R16.26/$ and pressed a little further, touching its weekly low of R16.22/$ at 11:00 SAST — walking neatly into the top of the target zone our 5 June call had marked. From there it consolidated, easing back to close the week at R16.29/$, a few cents off the low but comfortably stronger.
By the close, the Rand had finished the week 30 cents stronger against the dollar, and firmer against the euro and pound too. It was not, in the end, a story the dollar told. It was a story sentiment told — and the Rand, for once, was standing exactly where it needed to be when the mood turned.
Volatility and Risk Analysis
Thirty cents of Rand strength in five trading days — and, like last week, almost none of it spread evenly. Four sessions of grind and one Thursday evening that did most of the work in the space of a few hours.
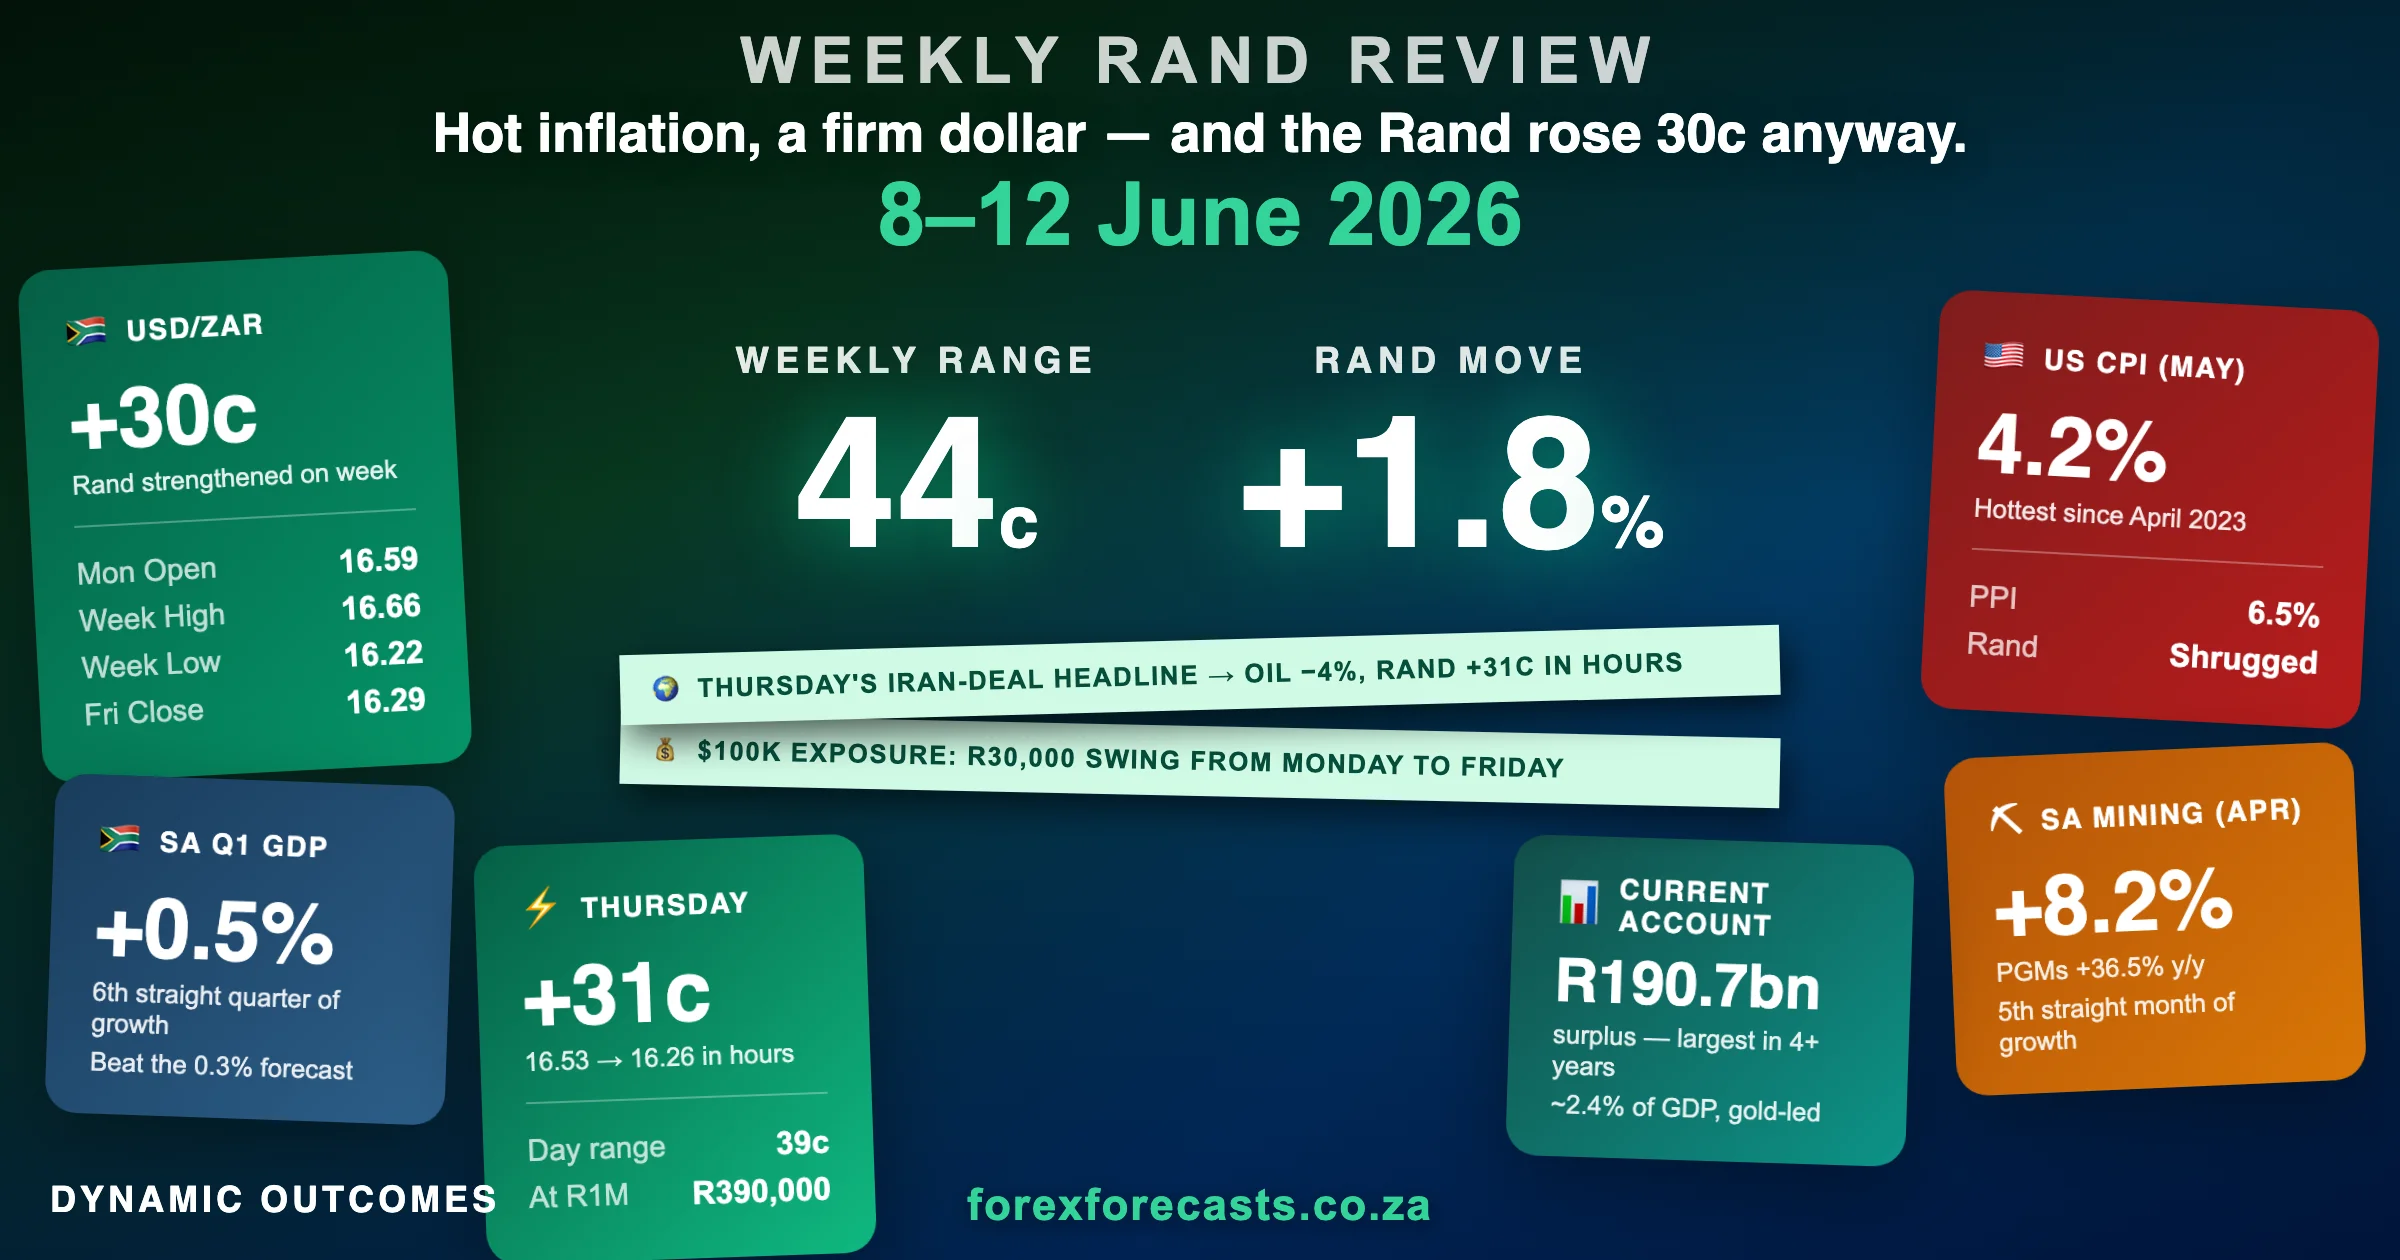
- Open to Close: R16.59 (Mon) → R16.29 (Fri) — 30 cents of Rand strengthening (1.8%). R300,000 of value swung per $1 million of exposure.
- Average Daily Range: 21.8 cents — R218,000 per $1 million per day.
- Maximum Single-Day Move: Thursday's 39-cent range (R16.62 to R16.22) — R390,000 per $1 million, more risk than any other single session of the week.
- Weekly Range: 44 cents (R16.22 to R16.66) — a 2.7% swing, R440,000 per $1 million.
To put it in practical terms: an importer who bought $100,000 at Friday's R16.29 close rather than Monday's R16.59 open saved roughly R30,000 — the patient buyer rewarded this week, the exact mirror of last week. The lesson sits in the timing, not the direction — the entire week's edge was decided in the four hours after 19:00 on Thursday.
The Week Ahead (15–19 June 2026)
At home, SA May CPI lands mid-week — the first read on whether the Reserve Bank's hard line on its 3% target is starting to bite. On the US side, the main event of the quarter: Kevin Warsh chairs his first FOMC meeting on 16–17 June, and after this week's three-year-high inflation readings, every word of his first press conference will be parsed. Globally, the central banks line up back to back — the Bank of Japan, the Bank of England and the Swiss National Bank — into a week thinned by Friday's Juneteenth holiday in the United States.
As for the Rand itself, the R16.22 zone we had been tracking has now been reached — and our latest call has already rolled the next targets lower again. Those levels we keep for the forecast itself, but the direction of travel has not changed.
Weeks like this one are the whole argument for timing. The hottest US inflation in three years landed mid-week and the Rand strengthened anyway — because a single Oval Office headline, not the data, decided the direction. The only thing that changes the outcome is knowing which window you're in before the payment lands, not after.
That is exactly what Strategic Rand is built for — cycle-based USD/ZAR forecasting for South African importers and exporters, with the levels, the targets, and the invalidation lines mapped out before the week begins.
To your success
James Paynter
Want the full Rand cycle picture?
Register Free for Rand Forecasts