Hot US Inflation...
...and the Rand Takes a Beating
Published 16 November 2026
Our cycles had the US dollar heading for R16.67–R16.85 before Monday's open.
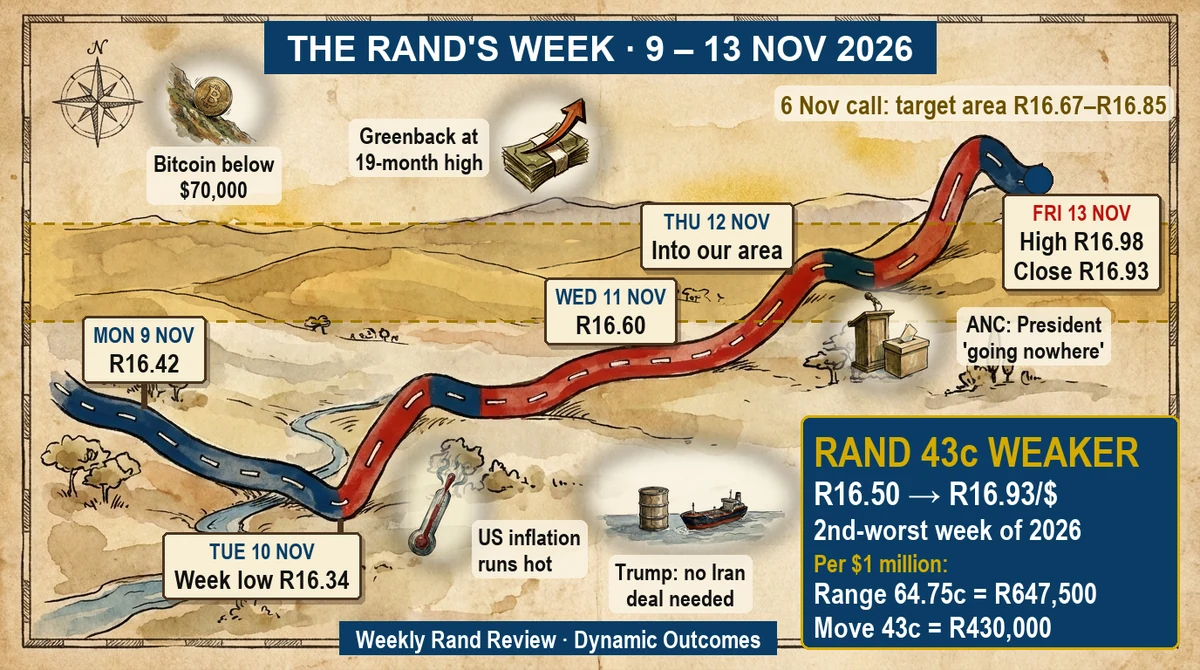
What moved the Rand last week: the Rand against the US dollar, 9 to 13 November 2026.
What moved the Rand last week?
Hot US inflation on Tuesday was the excuse the market needed. The Rand gave up its R16.34 low that afternoon, slid to R16.78 on Thursday as the US dollar index hit a 19-month high, and touched R16.98 on Friday. It finished the week of 9 to 13 November 2026 at R16.93/$, 43 cents weaker against the US dollar.
Well, what a difference a few days can make!
On Monday it was talk of peace in the Gulf and a softer US dollar...
...by Friday it was all about hot US inflation, a greenback flexing its muscles and a ruling party insisting its President is going nowhere!
And the poor Rand?
It limped home 43 cents weaker on the week and at its weakest Friday finish since early April.
Before we dig into how it all played out, here's the call we put out on Friday night, 6 November, before a single one of this week's headlines broke.
As can be seen, our sentiment cycles had the US dollar heading higher against the Rand, into an R16.67–R16.85 area, with a close above R16.85 opening the way to R16.98. A break below R16.39 would delay that, and a break below R16.33 would prove us wrong.
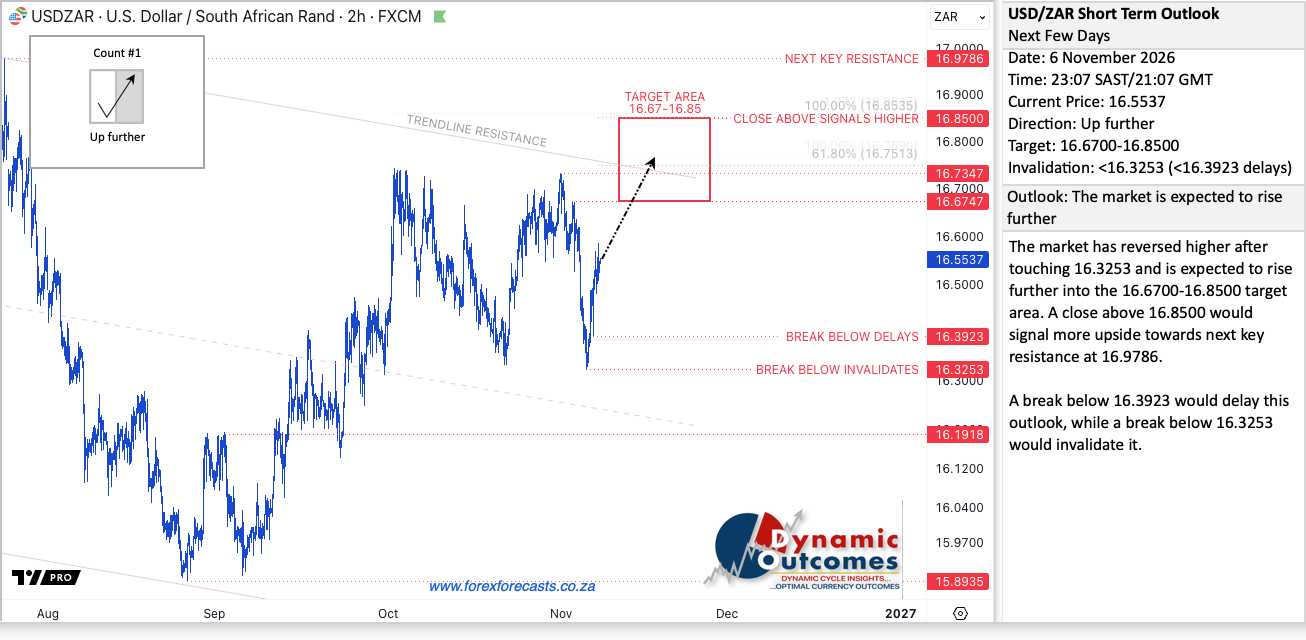
USD/ZAR Short Term Outlook, issued Friday 6 November 2026.
Before Monday had even dawned, it looked like this was going to be a humdinger of a week!
Key Moments (9–13 November 2026)
Some of the more pertinent headlines and events over the past week:
🇺🇸 US Inflation Runs Hot Again – How far above forecast was the core reading?
💰 The Greenback Hits a 19-Month High – What is driving the US dollar now?
🇿🇦 Ramaphosa Is "Going Nowhere" – So why does the ANC keep having to say it?
🛢 Trump Says He Doesn't Need an Iran Deal – And what did that do to oil?
🔴 Bitcoin Breaks Below $70,000 – When did we last see that?
The week got off to a cracking start for the Rand on Monday...
...as talk from Washington that the Iran war could soon be over sent Brent down nearly 6%, and the greenback lost some of its swagger.
The Rand wasted no time getting to work, pushing the US dollar down to R16.42/$, and it kept going into the night.
It went one better on Tuesday morning, getting all the way to R16.34, its best level of the week (Stats SA's jobless figures, with unemployment up to 33.7%, barely got a look-in).
But the underlying mood was not as positive as this push suggested, and the market only needed an excuse...
...which US inflation duly provided at 3:30pm our time.
Prices came in a notch hotter than expected (again!), with the core reading at 0.3% against the 0.2% the economists had pencilled in...
...and that was all the excuse the US dollar needed, climbing back to R16.58/$ by SA close.
Oddly enough, Brent had briefly dipped below $90 a barrel that same day for the first time since August, which would normally be a gift for the Rand.
Not this time!
Wednesday was meant to be a breather, with the US bond market shut for Veterans Day, and the Rand did claw its way back to R16.52 overnight...
...but it couldn't hold on, letting the US dollar creep back up to R16.60/$.
And in other news...
Trump on Iran: "We don't need a deal with Iran." On Monday the talk was of the war ending soon, and by Tuesday an Iranian security official was saying no talks were even under way.
On Wednesday Iran's Revolutionary Guards said two tankers had been hit by explosions on what they called an "unauthorized route".
Then on Thursday Trump posted that he doesn't need a deal with Iran at all, because "we've got their Strait!"
Oil traders could be forgiven for feeling seasick, with Brent going from briefly below $90 on Tuesday to around $96 on Thursday, and Hormuz still not reopened.
Saffers were counting on relief at the pump, with EWN reporting early data pointing to petrol dropping by more than R1.50 a litre in December...
...but a dearer oil price and a weaker Rand are exactly what eat into a cut like that.
The ANC's worst result – and a President "going nowhere". With the count done, the ANC sits on about 30.8%, the worst it has ever done in a local election.
Then the Sunday Times reported that President Ramaphosa was considering stepping down, and the week was spent with one ANC heavyweight after another insisting he is "going nowhere".
When a party has to say it that many times in one week, you have to wonder who it is trying to convince...
...the voters, or itself.
With the DA and ActionSA already exploring a deal on the Gauteng metros, it seems voters have finally had enough of empty promises for 32 years.
Bitcoin slips below $70,000. On Friday Bitcoin fell below $70,000 for the first time since 19 August, to around $67,600, with Ethereum dropping under $2,000 and XRP briefly below $1.
It came the day after Nvidia's CEO Jensen Huang resigned and sent chip stocks into a spin – and when the appetite for risk goes, Bitcoin is usually among the first out of the door.
For regular readers of our global forecasts, none of it came as a surprise. On 2 November we said Bitcoin could fall deeper into its $76,500–$66,925 area before bottoming, with $66,921 the level that had to hold...
...and that is just where it went this week.
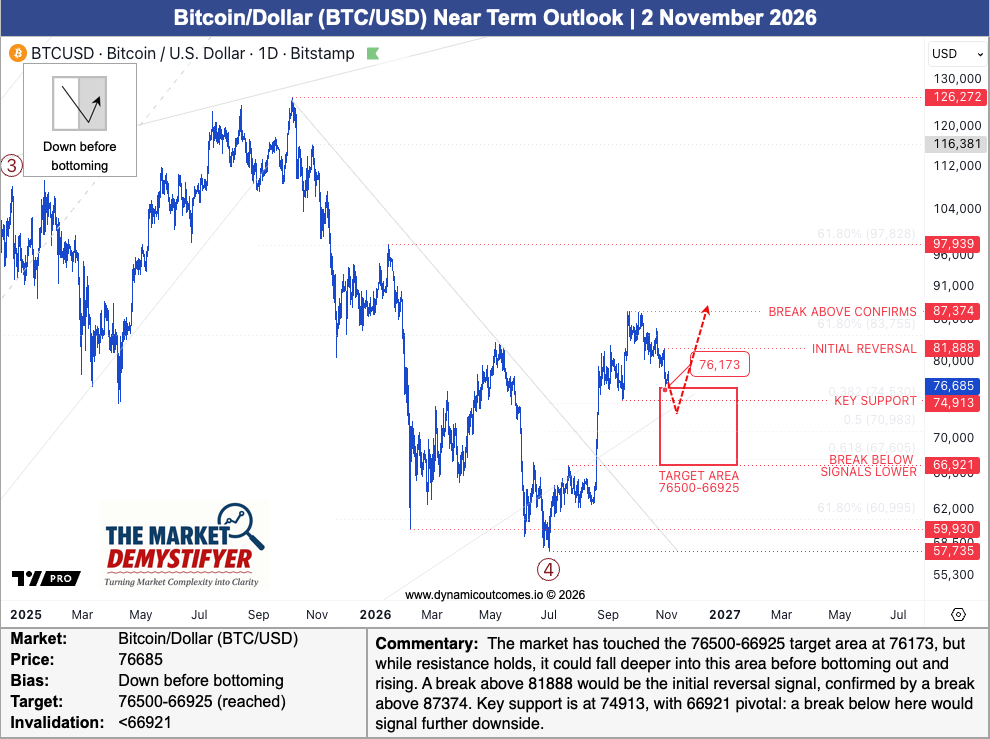
Bitcoin Near Term Outlook, issued 2 November 2026.
Our fortnightly Bitcoin, gold and US dollar forecasts come with Demystifyer Pro. Subscribe here.
To get back to the Rand, Thursday is where things really got away from it.
The US dollar had pushed through R16.67 by early afternoon...
...right into our target area.
The backdrop was a US dollar index at its strongest levels in about 19 months, oil climbing back on Trump's post and gold sliding to a 13-month low.
And by SA close, the Rand had coughed up another 17.7 cents, to hit R16.78/$.
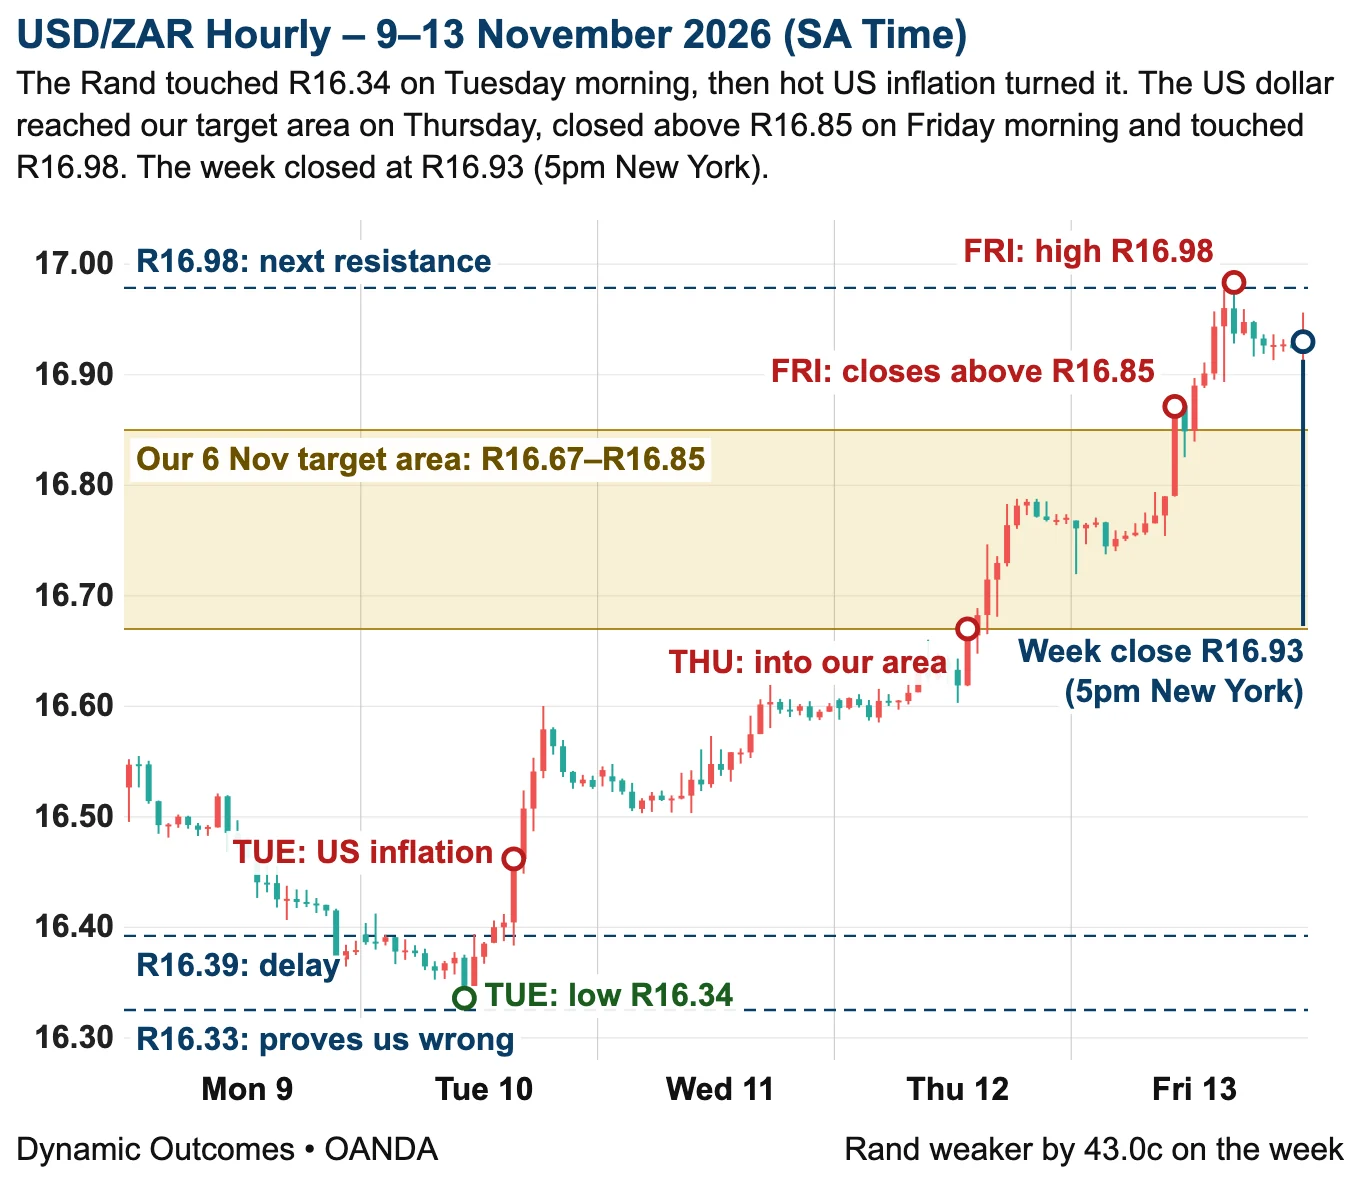
Friday gave it no breathing space at all, with the Rand on the ropes from the first bell...
...and by mid-morning the US dollar was through R16.85 and still climbing.
News24 put it down to US rate-hike fears and the "loud political noise" at home (there's always a culprit after the fact).
US producer prices came out in the afternoon, running 6.5% higher than a year earlier, and the greenback touched R16.98 within the hour...
...before the Rand dug in and fought its way back to close at R16.93/$, 43 cents down on the week.
And what of our call?
Monday night's slip below R16.39 delayed our call, and Tuesday morning's dip to R16.34 came close, but it never broke the R16.33 that would have proven us wrong...
...and from there the US dollar climbed into our area on Thursday and on to R16.98 on Friday, just as the chart had it mapped out!
Would you have done anything differently if you had had this objective view before last week's move?
For our latest update, subscribe here.
Volatility and Risk Analysis
For those of you with US dollar exposures, here's the week in Rand terms:
Open to Close Move: The week opened at R16.50/$ on Monday morning and closed at R16.93/$ on Friday – a 43.0c (2.6%) weakening.
Risk per $1 Million Exposure: R430,000
Average Daily Range: 20.75 cents (1.3%)
Risk per $1 Million Exposure: R207,500
Maximum Single-Day Move: 26.44 cents (1.6%), Tuesday's range
Risk per $1 Million Exposure: R264,400
Weekly Range: 64.75 cents (4.0%), R16.34 low to R16.98 high
Risk per $1 Million Exposure: R647,500
That's the Rand's second-worst week of the year, beaten only by the first week of March.
Bought your US dollars at Tuesday morning's low instead of Friday afternoon's high? Then you'd have kept R647,500 on every $1 million!
The Week Ahead (16–20 November 2026)
SA: President Ramaphosa is off to Silicon Valley from Sunday, on a trip the Presidency insists is "strictly about AI". At home, October's inflation numbers are out on Wednesday 18 November, and the SARB's rate decision follows on Thursday 19 November...
...with Nedbank expecting a hike (Investec, for one, isn't buying it).
US: Retail sales on Tuesday 17 November, and the Fed's October minutes on Wednesday 18 November.
Global: Nvidia reports on Tuesday 17 November with an interim CEO in the chair, and one more post from Trump on Iran could have oil jumping again.
What to Watch
Wednesday and Thursday are the big ones, with our own inflation numbers and the SARB back to back. And keep 27 November in the diary, when Moody's and S&P both take a look at SA's rating.
As for the Rand, our latest update still had the US dollar pointing higher (if you have US dollars to buy or sell this week, you'll want the levels in front of you).
Plenty of triggers again last week, from Washington to Luthuli House...
...but as always, it was the turn in sentiment that decided the direction.
How are you positioned for the week ahead? Hit reply and let me know.
To your success~
James Paynter
P.S. The call behind this week's review went out on Friday night, 6 November – target area, delay level and the line that would prove us wrong, all on the chart before Monday's open. We've been publishing calls like this for 20+ years, across 8,672 scored Rand forecasts. See the Strategic Rand forecasts
P.P.S. If you have significant Rand forex exposures...do you know how much extra you have been paying in forex spreads and fees – and what you could be saving, starting next week? Find out with our new FX savings calculator →
Get the next Weekly Rand Review free in your inbox on Monday morning.
Subscribe to the Weekly Rand ReviewHow much extra have you been paying in fees and spreads? FX savings calculator